1. Spectral characteristic graph and absorption intensity (Beer-Lambert law)
Infrared rays of specific wavelengths have characteristic of being absorption by molecules (atoms). The wavelengths that are absorption vary depending on the atoms configuration the molecule and their bonding state.
The graph below is an example of a spectral characteristic graph, with infrared absorption (transmission rate) on the vertical axis and wavelength (µm) on the horizontal axis.
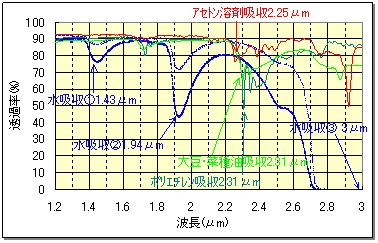
Each exhibits different characteristic, such as absorption characteristic of water, solvents, films, and oils.
Furthermore, absorption of this absorption characteristic increases depending on the amount (thickness) of the substance.
This is expressed as Lambert's (Lambert's) Beer's law by the following equation.

attenuation ⊿I = -α・I・⊿t (α: constant determined by absorption coefficient, material, and wavelength)
→ dI=-α・I・dt Integrate both sides with respect to t (t=0~t)
Infrared intensity I = I0 e^ (-α t)
Chino's infrared moisture and thickness gauges utilize characteristic of infrared light absorption wavelengths specific to a substance (functional group) and the fact that the amount of absorption changes depending on the amount (thickness) of that substance to measure the amount of each constituent in a substance.
2. Internal structure of the sensor
The internal configuration of the moisture /thickness gauge is shown below.
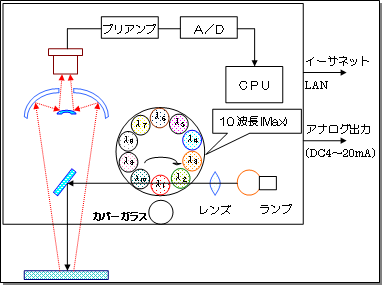
The light emitted from light source lamp passes through an optical filter to select only specific wavelengths and irradiate the substance. The irradiated infrared light is absorption by vibration of the measurement target (functional group), and the attenuation reflected light is re-focused by a concave mirror and incident on the light receiving element.
This optical filter is rotation by a motor and emits infrared light of different wavelengths intermittently (pulse waves). The infrared light received is converted into an electrical signal by detecting element, and each wavelength data is digitized and an absorbance signal is output.
3. Absorbance computation
The absorbance output of our moisture and thickness gauges is mainly as follows:
①2 wavelength ratio computation
absorption at two wavelengths: λs and reference wavelength λr (a reference wavelength with less absorption)
Absorbance X = K1-λs/λr
K1;Standardization constant (≈1)
②3 wavelength ratio computation
absorption wavelength λs, two reference wavelength λr1 and λr2 are used
Absorbance X = K1-λs/(α・λr1+(1-α)・λr2)
K1: normalization constant (≒1), α: wavelength weighting constant (0 < α < 1)
③Multiple regression computation
Each wavelength of the infrared light installed is designated as λ1 to λn, and since the absorption characteristic are exponential functions, the logarithm of each wavelength data is taken and computation using the following formula:
constituent value Y = a0 + a1 Log(λ1) + a2 Log(λ2) + ... an Log(λn)
(moisture, thickness, solvent, etc.)
The two-wavelength ratio computation in ① has the advantage of being able to reduce disturbance that cause fluctuations in the absolute value of the absorption intensity, such as external light, measurement distance, dust on the light path, and fluctuations in surface conditions, by taking the ratio of the amount of disturbance to a reference wavelength.
In addition, the 3-wavelength ratio computation in ② is an advanced version of the 2-wavelength calculation and has a strong advantage in detecting differences in the surface condition, color, and constituent ratio of the sample (which we call differences in texture).
In this ratio computation computation, calibration curve is then created using this absorbance to calculate the desired constituent values.
In the multiple regression computation in ③, once the coefficients of this formula are determined, the desired constituent value can be output directly. This multiple regression computation is a method for finding the desired constituent by incorporating each element (wavelength data) when the desired component is not represented by a single variable (one absorption wavelength) but is influenced (interfered with) by multiple factors (absorption wavelengths of moisture or thickness), and is generally used in statistical mathematics computation when dealing with multiple variables. To find the coefficients of this multiple regression computation, the measured values are applied and the result is in the form of a simultaneous normal equation.
Furthermore, when measuring multiple constituent simultaneously, simultaneous moisture and thickness measurements are possible by applying the coefficients of this multiple regression computation to each constituent.
4. calibration curve
This is a variable that increases or decreases according to the changes in 2 (moisture %, thickness in μm, solvent %, etc.) obtained in items ① and ②, and is not the amount of constituent itself.
calibration curve is needed to convert this absorbance value into the desired amount constituent.
calibration curve is an equation that is calculated by measuring the absorbance value (X value) of the sample to be measured with a moisture /thickness sensor at several level within the measurement range and using the least squares method (a method of finding a regression equation with the smallest error) from the actual measurement data.
< calibration curve data>
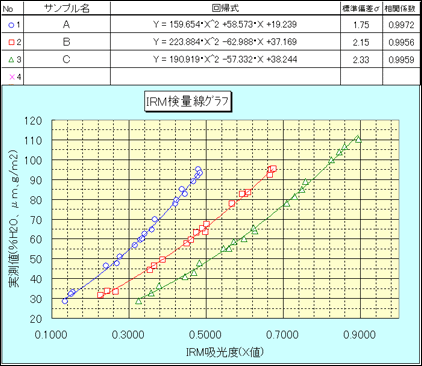
calibration curve is basically created for each product. Up to 99 calibration curve can be store in this sensor, and the calibration curve channel is switched each time product is changed.
*
Links to regression computation, standard deviations, and correlation coefficients
Reference Material 1. Relationship between calibration curve data and absorbance values based on Lambert's (Lambert's) Beer's law
In calibration curve data in the previous section, the relation between the measured value Y and the absorbance value X obtained by the wavelength ratio computation in 2(3) is calculated using a 1st to 3rd order polynomial. In contrast, in Lambert's (Lambert's) Beer's law, the absorbance is calculated using a logarithmic computation (when solved for thickness t, t=-(1/α) Log(I)+β).
The graph below shows the relationship between absorbance calculated from the theoretical formula based on Beer's Lambert's Law and quadratic or cubic regression computation using our "two wavelength ratio computation" when using thickness measurement as an example.
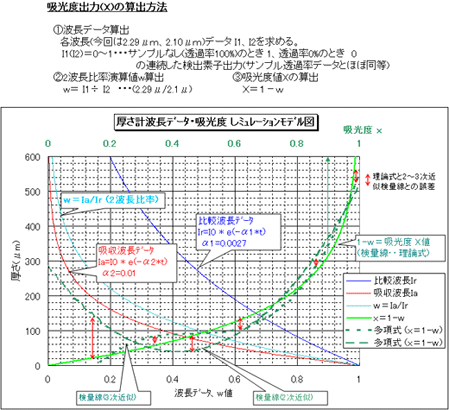
The red arrows in this model example indicate the error from the theoretical formula.
However, in reality, the measurement range is determined to some extent for each product (lot), and by performing detailed regression computation within that range, it is possible to reduce the error to a level that does not cause problems in use.
In addition, for multiple regression computation, the logarithm of each wavelength data (Logλn) is computation and computation are performed in the same way as the theoretical formula, which further improves the accuracy of the regression computation.
Reference Material 2. About smoothing (delay)
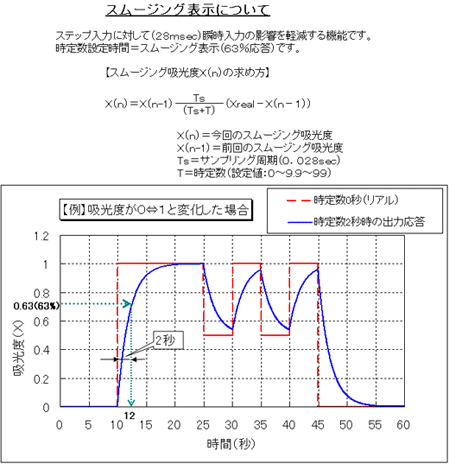
Our moisture and thickness gauges are mainly used for online measurements, but when online, various disturbance such as external light, measurement distance, dust on the light path, changes in surface condition, etc. can cause measurement data to fluctuate. Therefore, we perform the following computation process to remove these disturbance and enable stable measurements.
